Construction runs on numbers, and almost none of them arrive in time to change anything.
Every contractor and housebuilder already sits on more data than they have ever had. It lives in the ERP, in the valuations, in the cost reports, in a hundred spreadsheets on a hundred laptops. The problem was never a shortage of data. The problem is that by the time it is pulled together, checked and turned into a monthly report, the month it describes is already gone.
Construction analytics closes that gap. It takes the data your business already produces and turns it into something you can act on while there is still time to act. This page explains what construction analytics actually is, why traditional reporting keeps failing the industry, and what good looks like. It is written by the people who build InsightsControl™, the construction data platform, but you will not find a sales pitch here. What follows is the clearest explanation of construction analytics we could write.
Construction analytics is the practice of connecting the data a construction business produces, structuring it around the way construction actually works, and using it to answer forward-looking questions: where is margin leaking, which sites are drifting, when does cash get tight, which subcontractors carry risk.
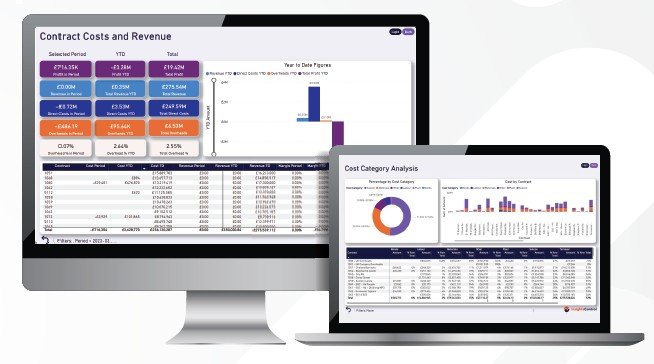
It is not the same as a dashboard, and it is not the same as a monthly report. A report shows you a number. Analytics shows you the number, the trend behind it, the cause underneath it and the decision it points to. Done properly it becomes the golden thread that runs through the whole business, one consistent version of the truth that finance, commercial and operations all work from.
The reason construction needs its own kind of analytics is that construction is not like other industries. Revenue is recognised on percentage complete. Margin hides inside cost value reconciliation. Cash is governed by applications, certificates, retentions and pay-when-paid. Generic business intelligence tools do not understand any of that out of the box. Construction analytics does.
Most construction businesses still run on a monthly reporting cycle that was designed decades ago. The commercial team closes their figures, finance consolidates, and four to six weeks after the period end the board finally sees what happened.
That lag is a solvency risk in its own right. A project can move from healthy to underwater inside a single reporting gap, and by the time the report lands the money is already spent and the decision window has closed.
Traditional reporting fails for reasons every construction leader will recognise. The numbers live in silos, so no two departments agree on the same figure. The work is manual, so skilled quantity surveyors and finance staff spend their days rekeying instead of analysing. And it is retrospective by design, so it can only ever tell you what already went wrong. McKinsey put it bluntly in 2026: most construction data exists but is unusable, because it is inconsistent, siloed and stuck in spreadsheets.
The real competitor here is not another software vendor. It is the phrase “we have always done it this way”.
Reporting and analytics get used as if they mean the same thing. They do not, and the gap between them is where most of the value sits.
Reporting tells you what happened. It is backward looking, periodic and descriptive. It answers the question “what were the numbers last month”.
Analytics tells you what to do next. It is continuous, forward looking and diagnostic. It answers “why is this project losing margin, and what happens to cash if the trend holds”.
The anti-Excel thread runs right through it. Click. Not download. Drill. Not email. Consolidated. Not copied. Current. Not yesterday. A business that only reports is always looking in the mirror. A business that runs on analytics is looking through the windscreen.
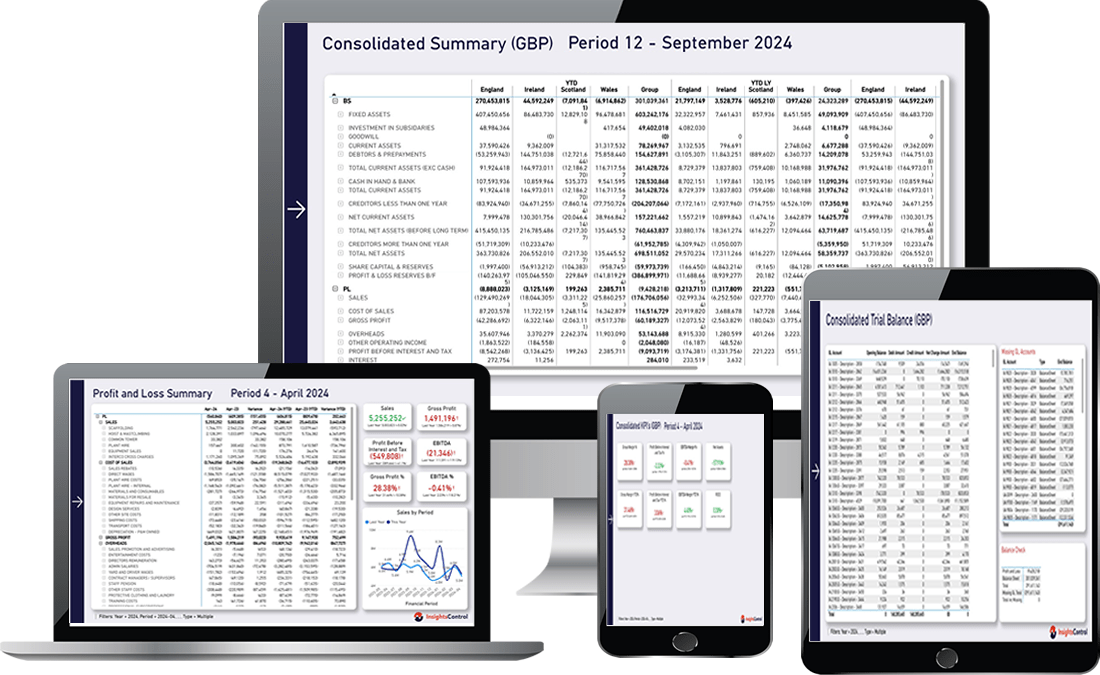
Financial analytics is where the board feels the difference first. It brings cash flow, work in progress, overhead recovery and group consolidation into one live view instead of a spreadsheet that is stitched together after the event.
For a CFO the value is simple. You see the cash position across every project and entity as it stands today, not as it stood at the last period end. You see work in progress building or unwinding before it becomes a surprise. You can consolidate a group of trading companies in seconds rather than days. Early warning on cash is the single most valuable output analytics can give a construction business, because cash is what actually ends companies.
Commercial analytics is where margin is won and lost. It puts cost value reconciliation, valuations, applications and final accounts under a live lens, so drift is visible while it can still be corrected.
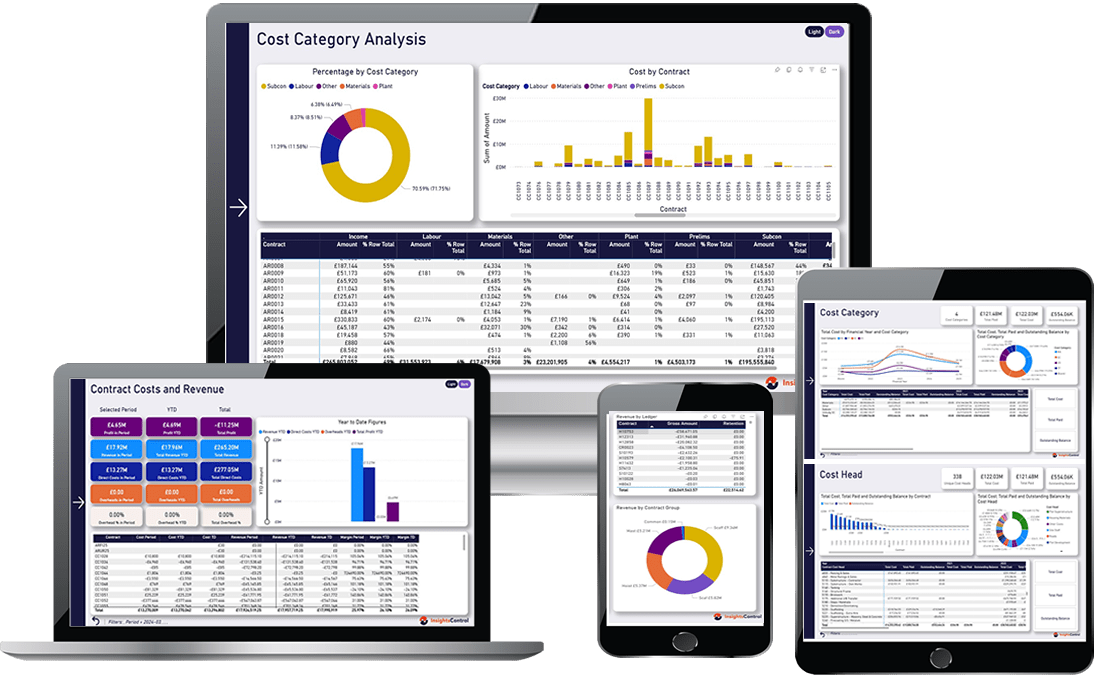
The classic failure is the gap between what has been valued and what will actually be certified. We have seen a single reconciliation hide a thirty thousand pound hole that nobody had spotted, because the valuation and the certificate were never looked at side by side. Commercial analytics closes that gap. It shows margin erosion as it happens, flags underclaimed applications, and gives the commercial director the thing they actually want, which is proof that their forecast is right, not a system that second-guesses them.
Housebuilding runs on a different rhythm to contracting, and it needs analytics built around the plot, the outlet and the sales rate rather than the contract.
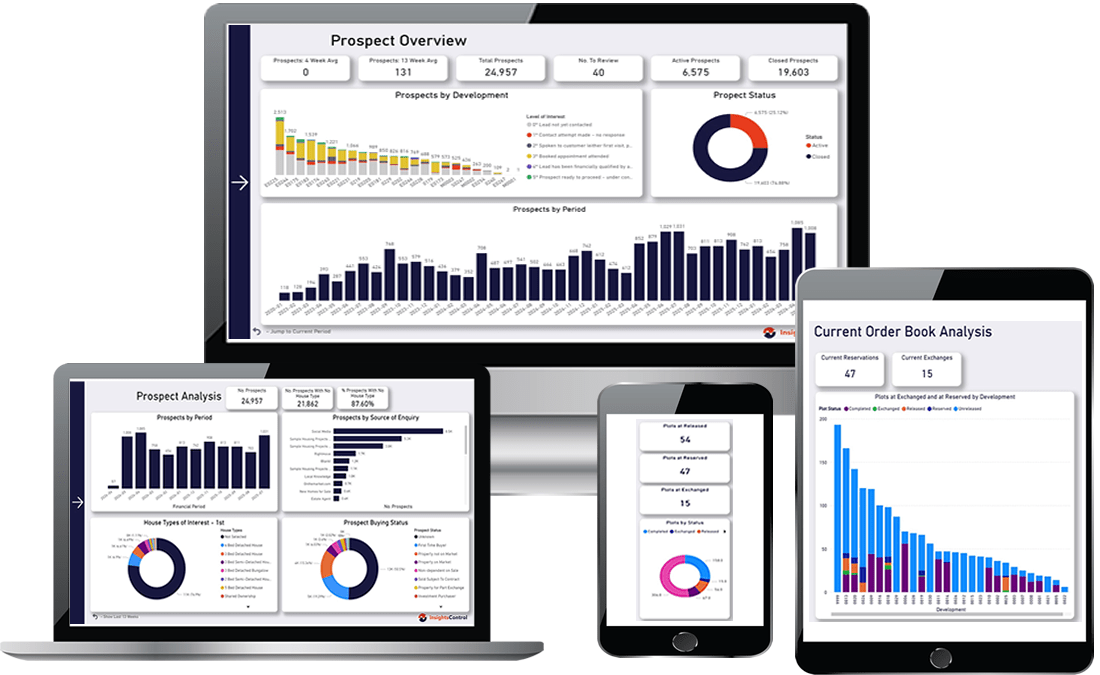
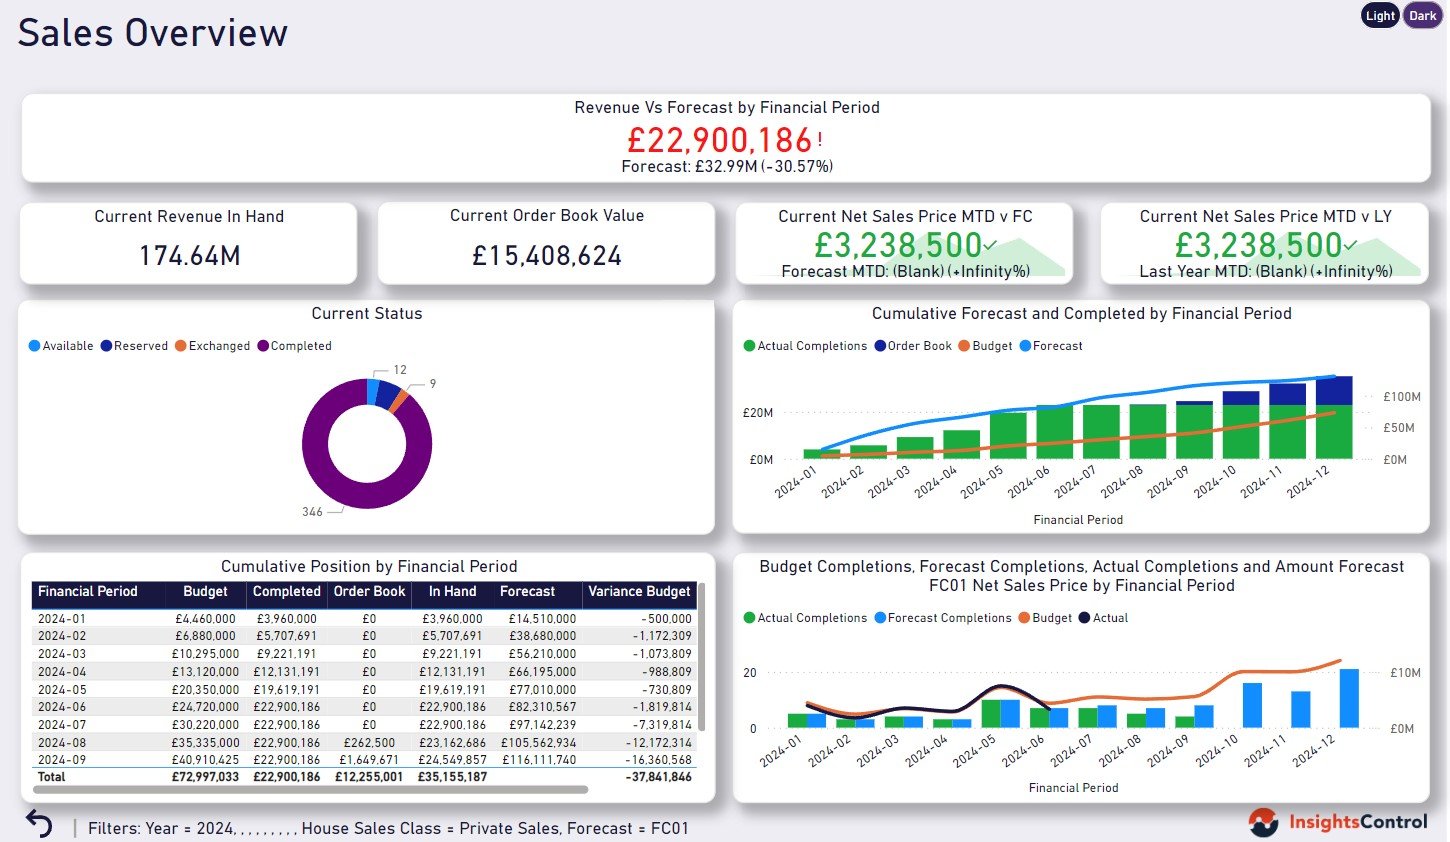
Good housebuilding analytics ties the whole cycle together: prospects and reservations, sales rate against the build programme, plot-level margin, and customer care once people have moved in. The detail matters more than most reporting ever reaches. On one housebuilder we found one development running fifty-six defects per plot against twenty-nine on another, and a single defect that had sat buried in the data for a hundred and seventy-three days. Those are not statistics. They are cost, reputation and cash, all of which were invisible in the monthly pack.
Artificial intelligence is about to decide which construction businesses lead the next decade, and the dividing line is who controls their data. McKinsey is clear that AI will not be an extinction event for the industry, but it could meaningfully change who leads it, and that more value and profit will go to the firms that control their project data and the workflows where decisions get made.
That is the honest framing. AI cannot do anything with data that is inconsistent, siloed and stuck in spreadsheets. The foundation has to come first. A construction business that gets its data structured and governed today is the business that can put AI to work tomorrow, whether that is surfacing early warnings automatically, spotting the patterns a QS would recognise, or turning experienced judgement into something the whole business can rely on rather than two or three people who have seen it all before. Where the industry is heading is clear. Getting the data right is how you get there.
Access Coins is the market leading ERP solution that most serious contractors and housebuilders run their business on, and it holds an enormous amount of value. Getting that value out of it is the hard part.
Access Coins is built to run the business, not to analyse it. The data is all there, but reporting straight out of the ERP is slow, technical and rarely gives finance and commercial the same answer. Access Coins analytics, combined with InsightsControl™ means you can now layer a full analytics solution on top of your Access Coins data. The Analytics module allows you to synchornise your data to Azure SQL or Fabric where InsightsControl™ then takes over. It takes your raw Coins data, it transforms and models it the way construction works, and then turns it into live insights without disrupting the core system you already rely on. You get keep your Access Coins system and use it as you have been doing, but now you finally get to access your data and see everything it knows without having the exorbitant costs that are associated with trying to develop and support an analytics solution in house.

Power BI is an excellent tool, and it is also where a lot of construction analytics projects quietly stall. The reason is worth understanding before you invest.
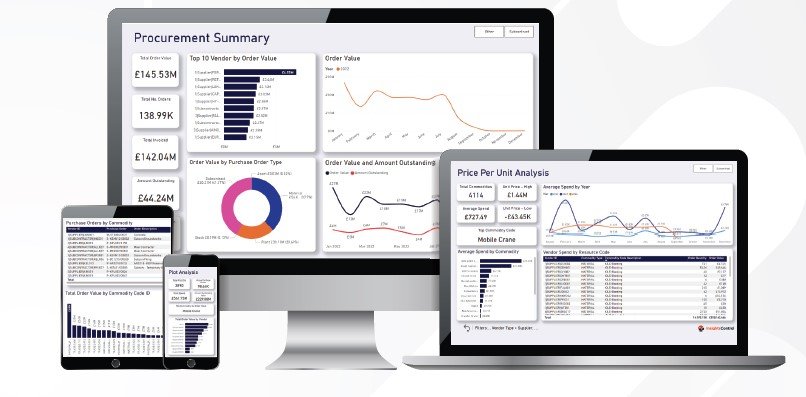
Power BI visualises data. It does not, on its own, understand construction. Point it at a raw ERP and you still have to build the entire construction data model underneath it: the cost value reconciliation logic, the WIP treatment, the plot and package structures, the definitions that make finance and commercial agree. That modelling is the real work, and it is the part most in-house Power BI efforts underestimate. This is why a stack of Power BI reports is not the same thing as a construction analytics solution. The chart is the last five percent. The construction data model is the other ninety-five.
A construction data platform is the layer that makes all of the above possible. It connects your whole data landscape into one cohereant, consistant data model. So the data in the systems you already run, your main ERP, andr other point solutions such as Health & Safety, HR, Quality Control etc, is available in one location.

The data is structured to provide insights from across your business, through a single interface. Your data, and the calculations used to generate your key figures and metrics, is contained within a governed and protected source, so there is one version of the truth, and is available to whoever needs it across your business, at the click of button everyday.
Data platforms are where the industry is heading. Instead of every department maintaining its own spreadsheets and its own version of the numbers, the whole business works from one governed source. InsightsControl™ is built on Microsoft Fabric, the same platform Microsoft has bet its own data future on, which is what makes it robust, scalable and supportable rather than a fragile stack of custom reports.
A construction data platform is the golden thread made real: one place where finance, commercial and operations finally see the same business.
InsightsControl™ is the construction data platform SPS built to do everything on this page.
It gives construction businesses what they have never had: a single, governed view of the whole business in real time, so they can control what happens next, not just report on what they have already done. It connects to the ERP you already run, structures your data around construction, and surfaces the problems that sink construction businesses months before they become unrecoverable, while there is still time to act.
Don’t report on your business. Control it.
What is construction analytics?
Construction analytics is the practice of connecting the data a construction business already produces, structuring it around the way construction works, and using it to answer forward-looking questions about margin, cash, risk and progress. Unlike a report, it is continuous and diagnostic, so it tells you what to do next rather than only what already happened.
How is construction analytics different from business intelligence?
Business intelligence is a general set of tools for visualising data. Construction analytics is BI built specifically around construction, including cost value reconciliation, work in progress, retentions, plot margin and subcontract exposure. Generic BI tools do not understand any of that until someone builds the construction data model underneath them.
Do I need to replace my ERP system?
No. Good construction analytics connects to the ERP you already run, including Access COINS, and adds an analytics layer on top. There is no new ERP, no process change and no rip and replace.
Is Power BI enough on its own?
Power BI is a strong visualisation tool, but on its own it is not a construction analytics solution. The value sits in the construction data model beneath the charts, which is the part in-house Power BI projects most often underestimate.
How long does it take to go live?
Because InsightsControl™ connects to systems you already have rather than replacing them, implementation is measured in weeks, not the many months a traditional software rollout would take.
Is my data ready for analytics?
Most construction businesses worry their data is too messy to start. In practice the data is almost always there, it is just inconsistent and siloed. Structuring and governing it is exactly what a construction data platform does, so imperfect data is a reason to start, not a reason to wait.
What return should I expect?
The return comes from catching margin erosion, cash risk and operational drift early enough to act, and from freeing skilled staff from manual reporting. The value of a single problem caught in time, a cash surprise avoided or a margin leak closed, typically covers the investment many times over.
 Cost
Risk
Cost
Risk
See what your financial reporting looks like when it’s working properly. Twenty minutes. No obligation.